Spatial analysis
Overview
Teaching: 15 min
Exercises: 10 minObjectives
plot occ & raster together
extract environmental conditions of occ raster layers
crop raster layers
draw background samples
randomly separate samples
4.0 Prepare occ & raster
library("raster")

if(!file.exists("data/occ_raw.rdata")){
  occ_raw <- gbif(genus="Dasypus",species="novemcinctus",download=TRUE)
  save(occ_raw,file = "data/occ_raw.rdata")
}else{
  load("data/occ_raw.rdata")
}
occ_clean <- subset(occ_raw,(!is.na(lat))&(!is.na(lon)))
occ_unique <- occ_clean[!duplicated( occ_clean[c("lat","lon")]  ),]
occ_unique_specimen <- subset(occ_unique, basisOfRecord=="PRESERVED_SPECIMEN")
occ_final <- subset(occ_unique_specimen, year>=1950 & year <=2000)
coordinates(occ_final) <- ~ lon + lat
myCRS1 <- CRS("+init=epsg:4326") # WGS 84
crs(occ_final) <- myCRS1

if( !file.exists( paste0("data/bioclim/bio_10m_bil.zip")   )){
  utils::download.file(url="http://biogeo.ucdavis.edu/data/climate/worldclim/1_4/grid/cur/bio_10m_bil.zip",
                       destfile="data/bioclim/bio_10m_bil.zip"   )
  utils::unzip("data/bioclim/bio_10m_bil.zip",exdir="data/bioclim")
}

bio1 <- raster("data/bioclim/bio1.bil")
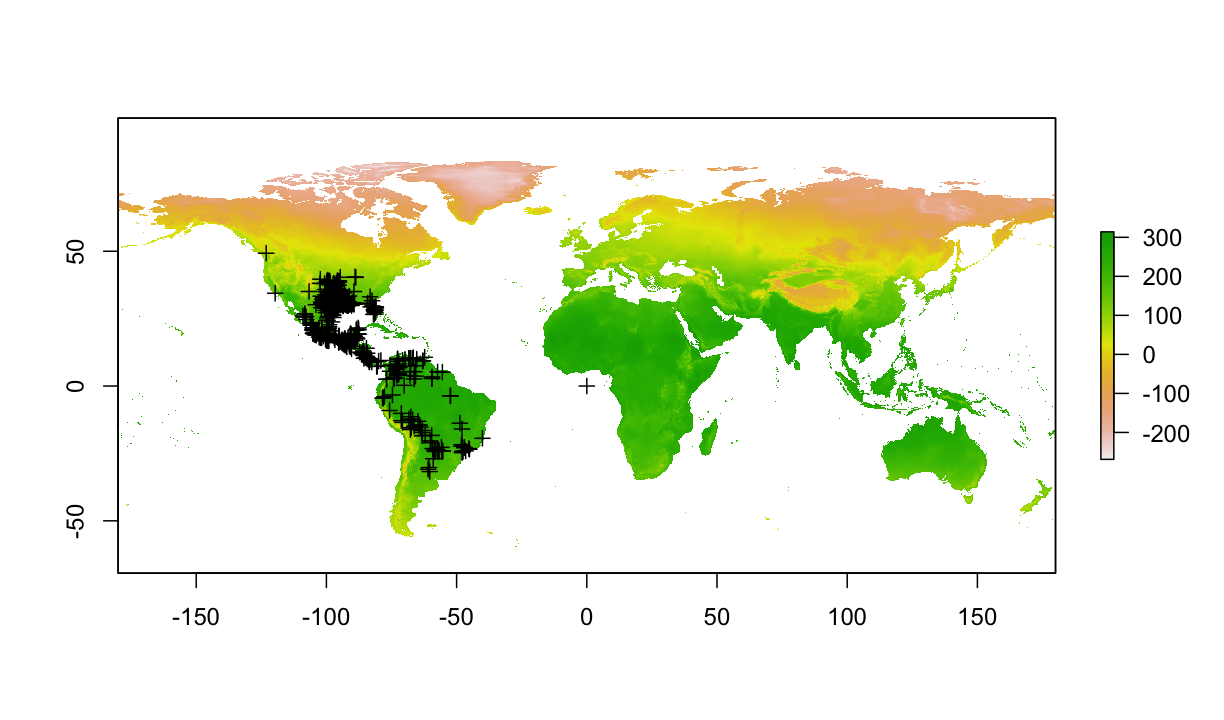
4.1 Plot occ & raster together
plot(bio1)
plot(occ_final,add=T)
4.2 Extract environmental conditions of occ raster layers
use extract() function to extract environmental conditions of occurrences
# load bioclimatic layers
clim_list <- list.files("data/bioclim/",pattern=".bil$",full.names = T)
clim <- raster::stack(clim_list)

conditions_occ <- extract(clim,occ_final)
head(conditions_occ)
     bio1 bio10 bio11 bio12 bio13 bio14 bio15 bio16 bio17 bio18 bio19 bio2
[1,]  251   261   242  3170   428    67    51  1221   240   382   946   95
[2,]  262   280   242   944   263     2   112   647    13   479    35  115
[3,]  184   274    87   537    82    19    45   197    70   156    70  148
[4,]  258   276   236   866   218     2   108   592     8   485    28  133
[5,]  257   273   235  3058   517    61    67  1402   205   677   321  112
[6,]  269   286   248   993   262     1   112   594     7   305     7  102
     bio3 bio4 bio5 bio6 bio7 bio8 bio9
[1,]   76  723  318  194  124  247  258
[2,]   72 1554  330  171  159  279  243
[3,]   42 7262  351    1  350  235   96
[4,]   72 1592  339  155  184  272  242
[5,]   70 1458  337  177  160  264  257
[6,]   64 1533  348  191  157  279  255
remove occurrences that have NA conditions
bad_records <- is.na( conditions_occ[,1] )
table(bad_records)
bad_records
FALSE  TRUE
  607     3
look at the bad records, and remove them
conditions_occ[bad_records,]
     bio1 bio10 bio11 bio12 bio13 bio14 bio15 bio16 bio17 bio18 bio19 bio2
[1,]   NA    NA    NA    NA    NA    NA    NA    NA    NA    NA    NA   NA
[2,]   NA    NA    NA    NA    NA    NA    NA    NA    NA    NA    NA   NA
[3,]   NA    NA    NA    NA    NA    NA    NA    NA    NA    NA    NA   NA
     bio3 bio4 bio5 bio6 bio7 bio8 bio9
[1,]   NA   NA   NA   NA   NA   NA   NA
[2,]   NA   NA   NA   NA   NA   NA   NA
[3,]   NA   NA   NA   NA   NA   NA   NA
occ_final <- occ_final[!bad_records,]
4.3 Crop raster layers
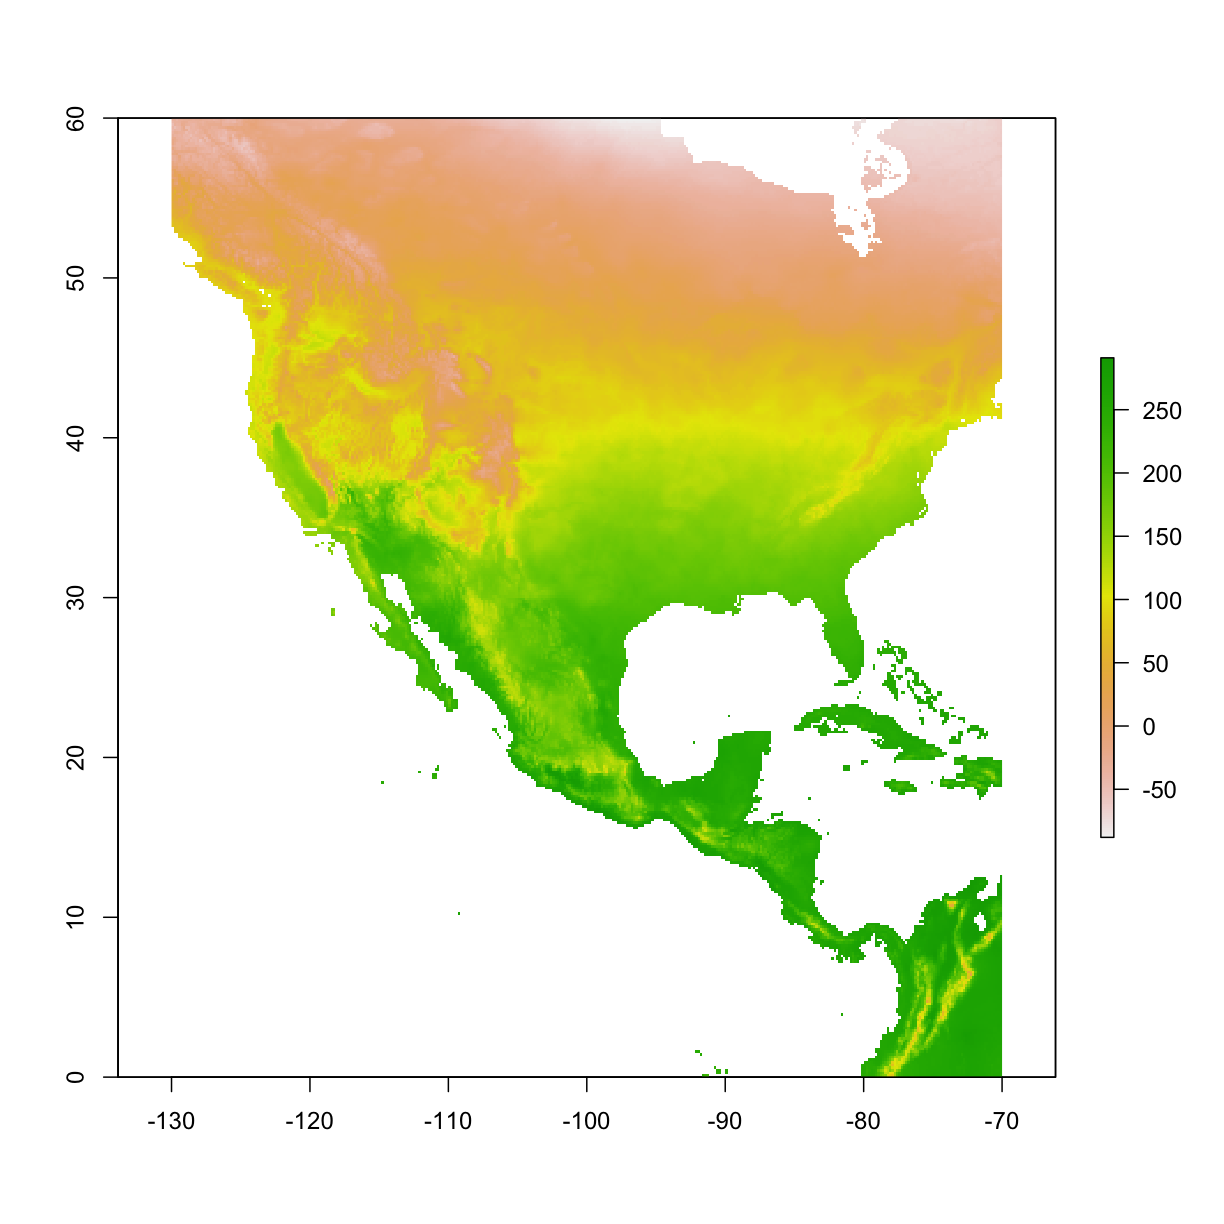
use crop() function to crop a raster layer
bio1 <- raster("data/bioclim/bio1.bil")

mybox <- extent(-130,   -70,     0,    60)
              #min x, max x, min y, max y
bio1_crop <- crop(bio1, mybox)

plot(bio1_crop)
 use
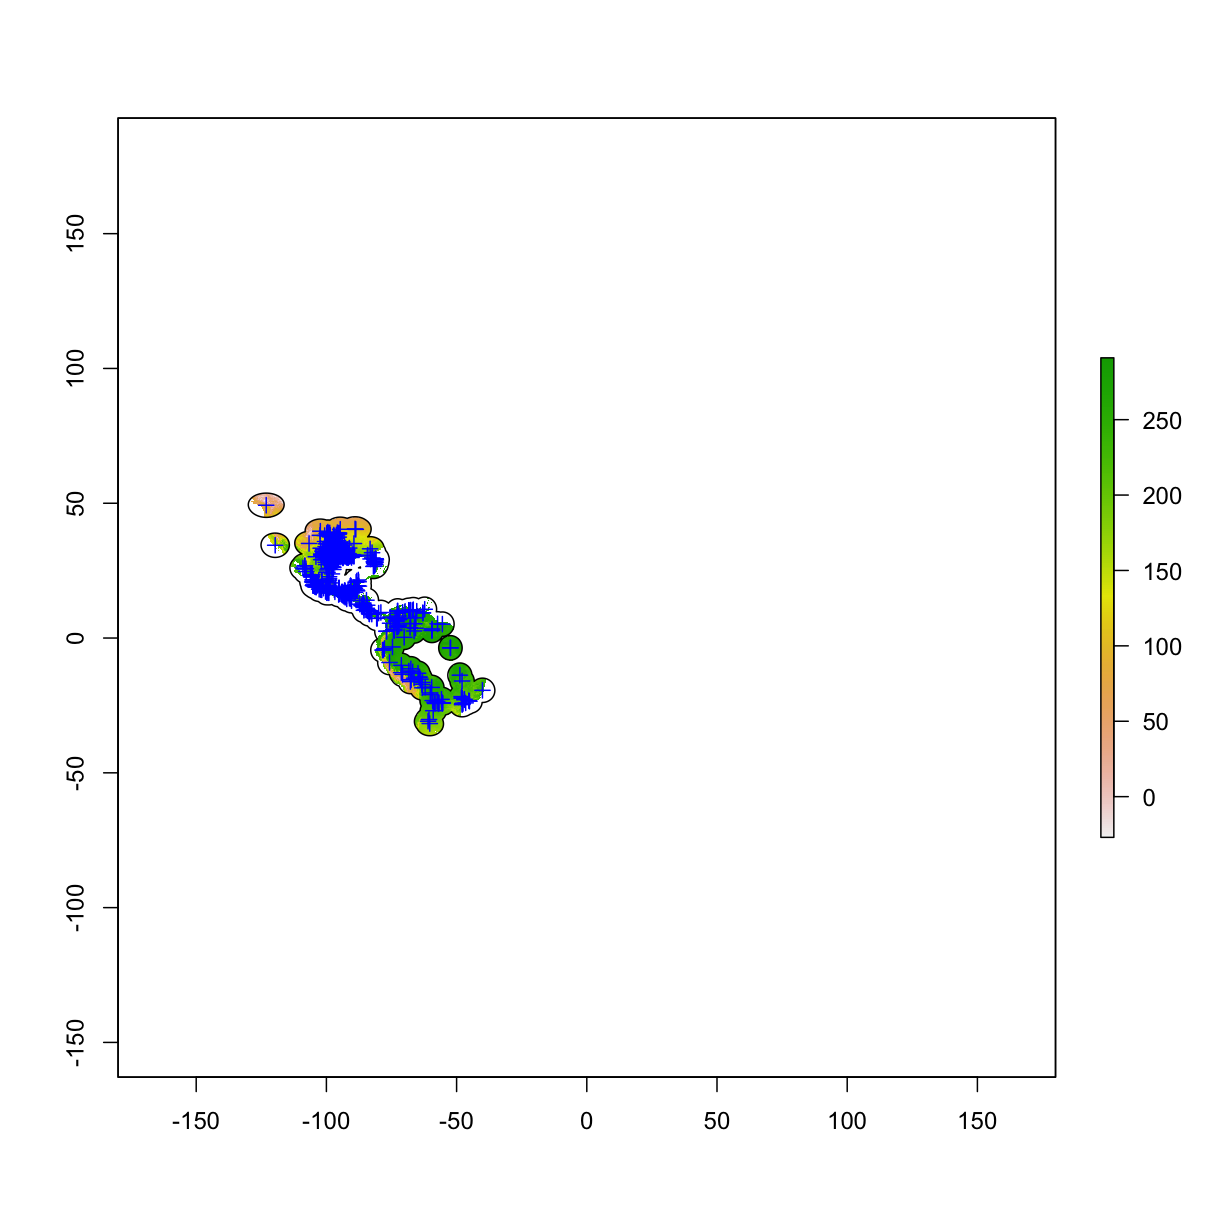
use mask() function to cut a raster with fine boundry
bio1 <- raster("data/bioclim/bio1.bil")

occ_buffer <- buffer(occ_final,width=5*10^5) #unit is meter
Loading required namespace: rgeos
bio1_mask <- mask(bio1, occ_buffer)

plot(bio1_mask)
plot(occ_buffer,add=T)
plot(occ_final,add=T,col="blue")
 this can also be applied to multiple rasters
# load bioclimatic layers
clim_list <- list.files("data/bioclim/",pattern=".bil$",full.names = T)
clim <- raster::stack(clim_list)

occ_buffer <- buffer(occ_final,width=5*10^5) #unit is meter
clim_mask <- mask(clim, occ_buffer)
4.4 Draw background samples
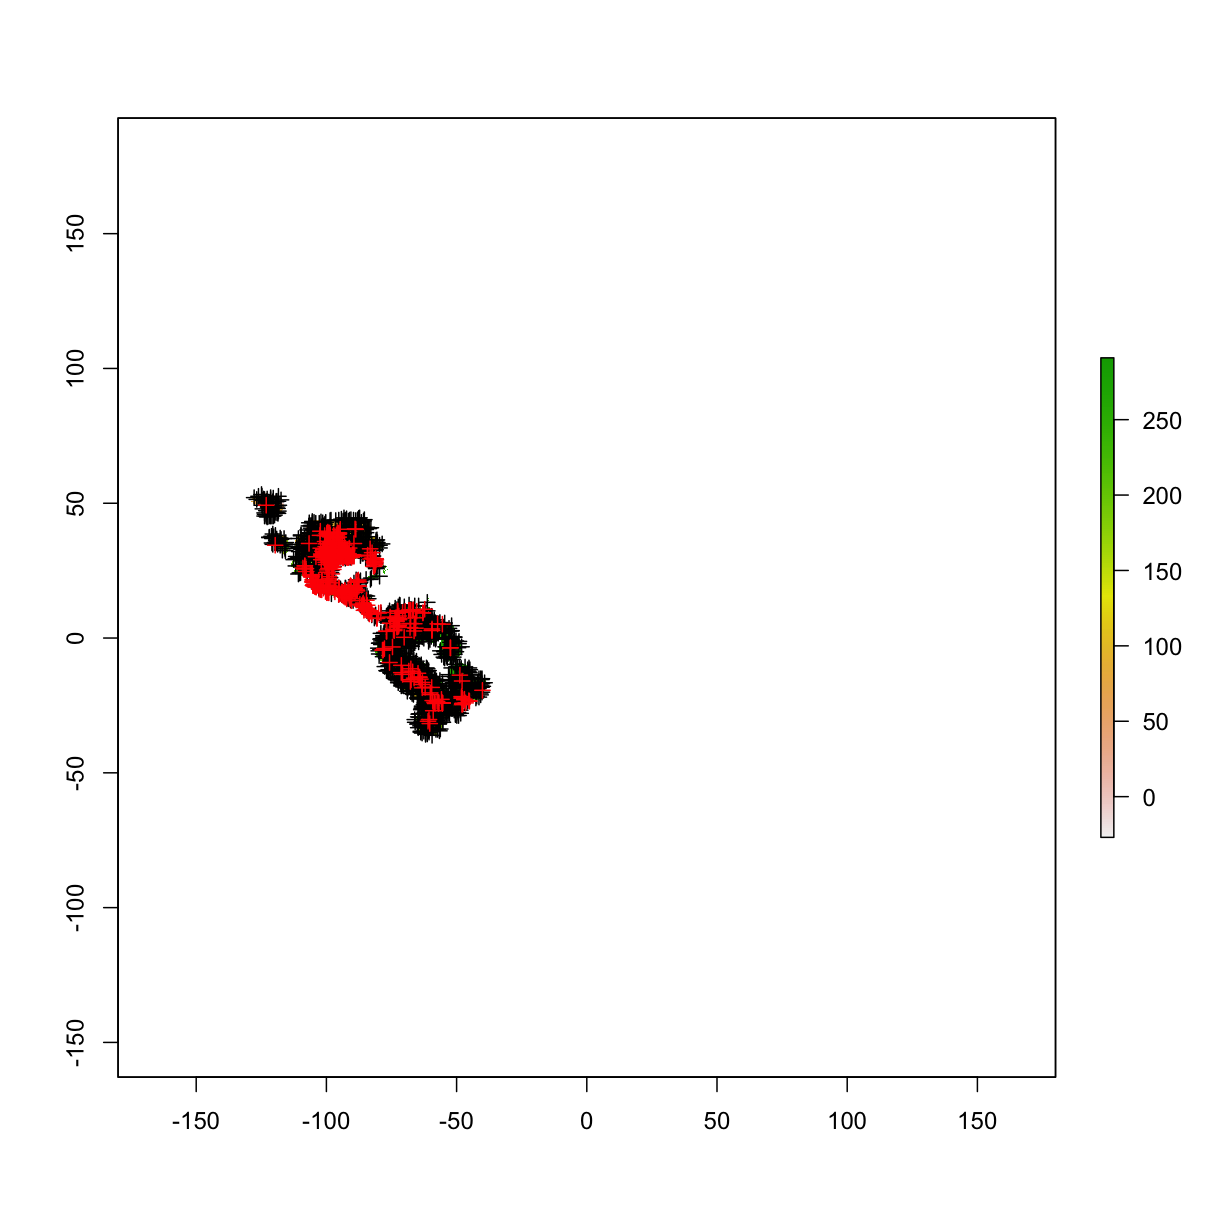
use sampleRandom() function to select background points from the new buffered study area; the number provided in the size.
use set.seed() before random sampling to guarantee the same random sample
set.seed(1)
bg <- sampleRandom(x=clim_mask,
                   size=10000,
                   na.rm=T, #removes the 'Not Applicable' points
                   sp=T) # return spatial points

head(bg)
  bio1 bio10 bio11 bio12 bio13 bio14 bio15 bio16 bio17 bio18 bio19 bio2
1  262   270   248  1427   244    11    69   672    52   333    87  122
2  257   277   226  1118   187    25    58   495    82   476   115  113
3  249   252   245  2048   332    15    68   946    57   468    57  129
4  241   280   197  1198   147    28    39   423   126   401   134  125
5  104   106    99  1006   124    39    31   338   147   332   147  103
6  210   229   184  1415   319     7    87   793    26   575    44  120
  bio3 bio4 bio5 bio6 bio7 bio8 bio9
1   70  906  347  175  172  266  251
2   66 2155  336  166  170  277  228
3   77  314  332  165  167  247  245
4   58 3291  348  133  215  274  208
5   90  281  161   47  114  105   99
6   65 1787  291  109  182  225  189
plot(clim_mask[[1]])
# add the background points to the plotted raster
plot(bg,add=T,col="black")
# add the occurrence data to the plotted raster
plot(occ_final,add=T,col="red")
4.5 Split occurrence data into training & testing
We randomly selected 50% of the occurrence data for model training and used the remaining 50% for model testing. To make our experiment reproducible (i.e., select the same set of points), we used a static seed via the set.seed() function.
# get the same random sample for training and testing
set.seed(1)

# randomly select 50% for training
selected <- sample(  1:nrow(occ_final),  nrow(occ_final)*0.5)

occ_train <- occ_final[selected,] # this is the selection to be used for model training
occ_test <- occ_final[-selected,] # this is the opposite of the selection which will be used for model testing
plot(occ_train,col="blue")
plot(occ_test,col="red",add=T)
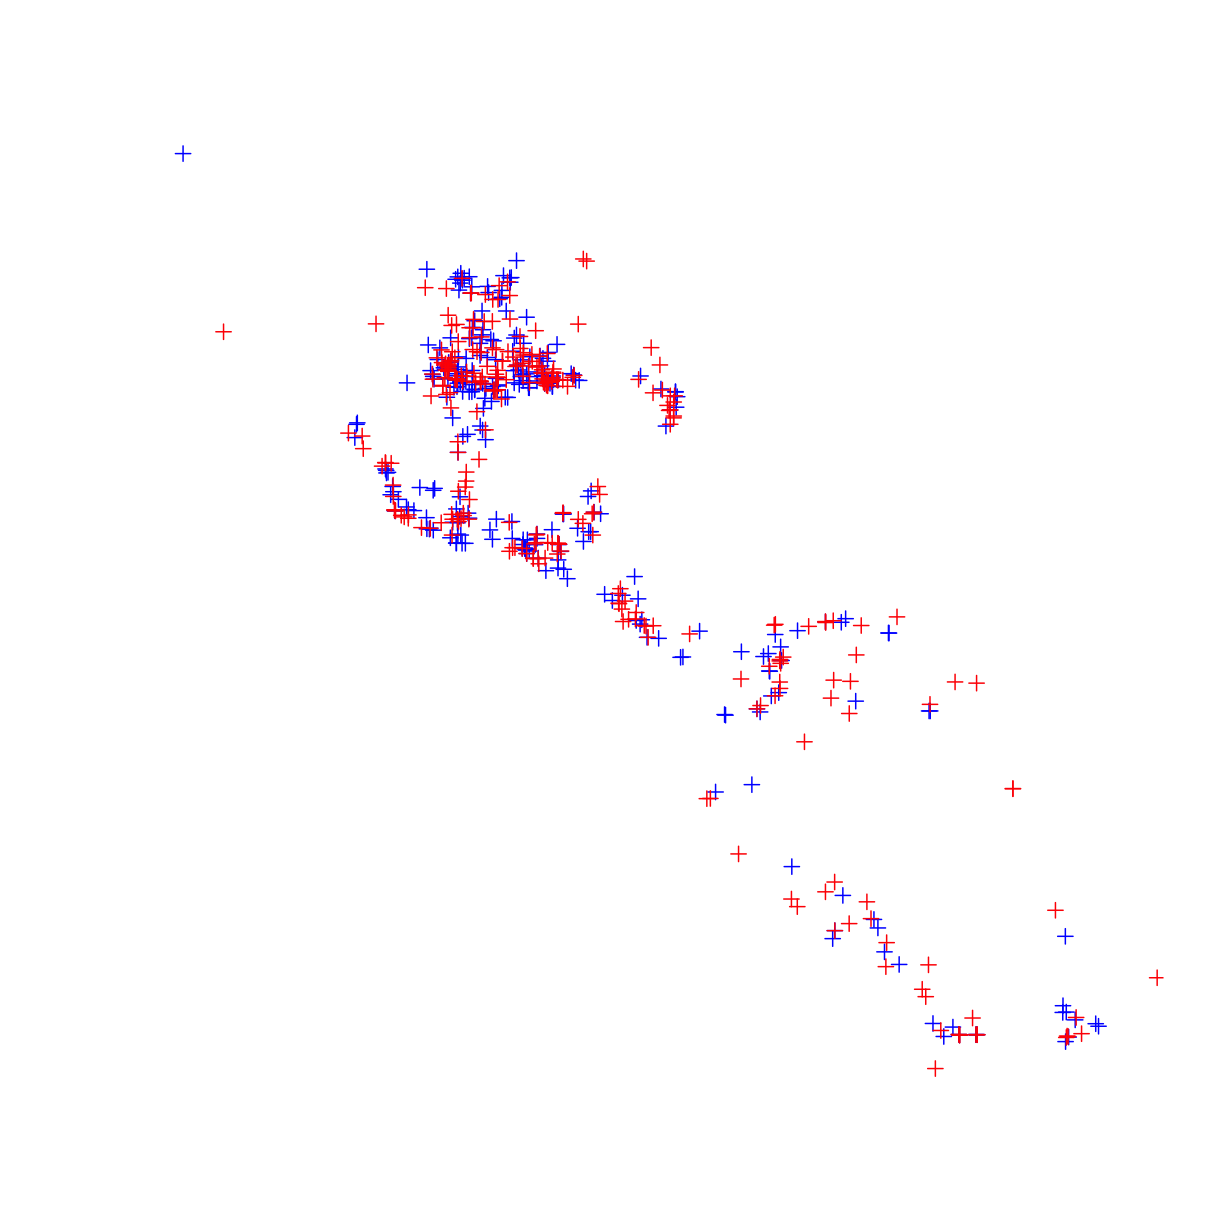
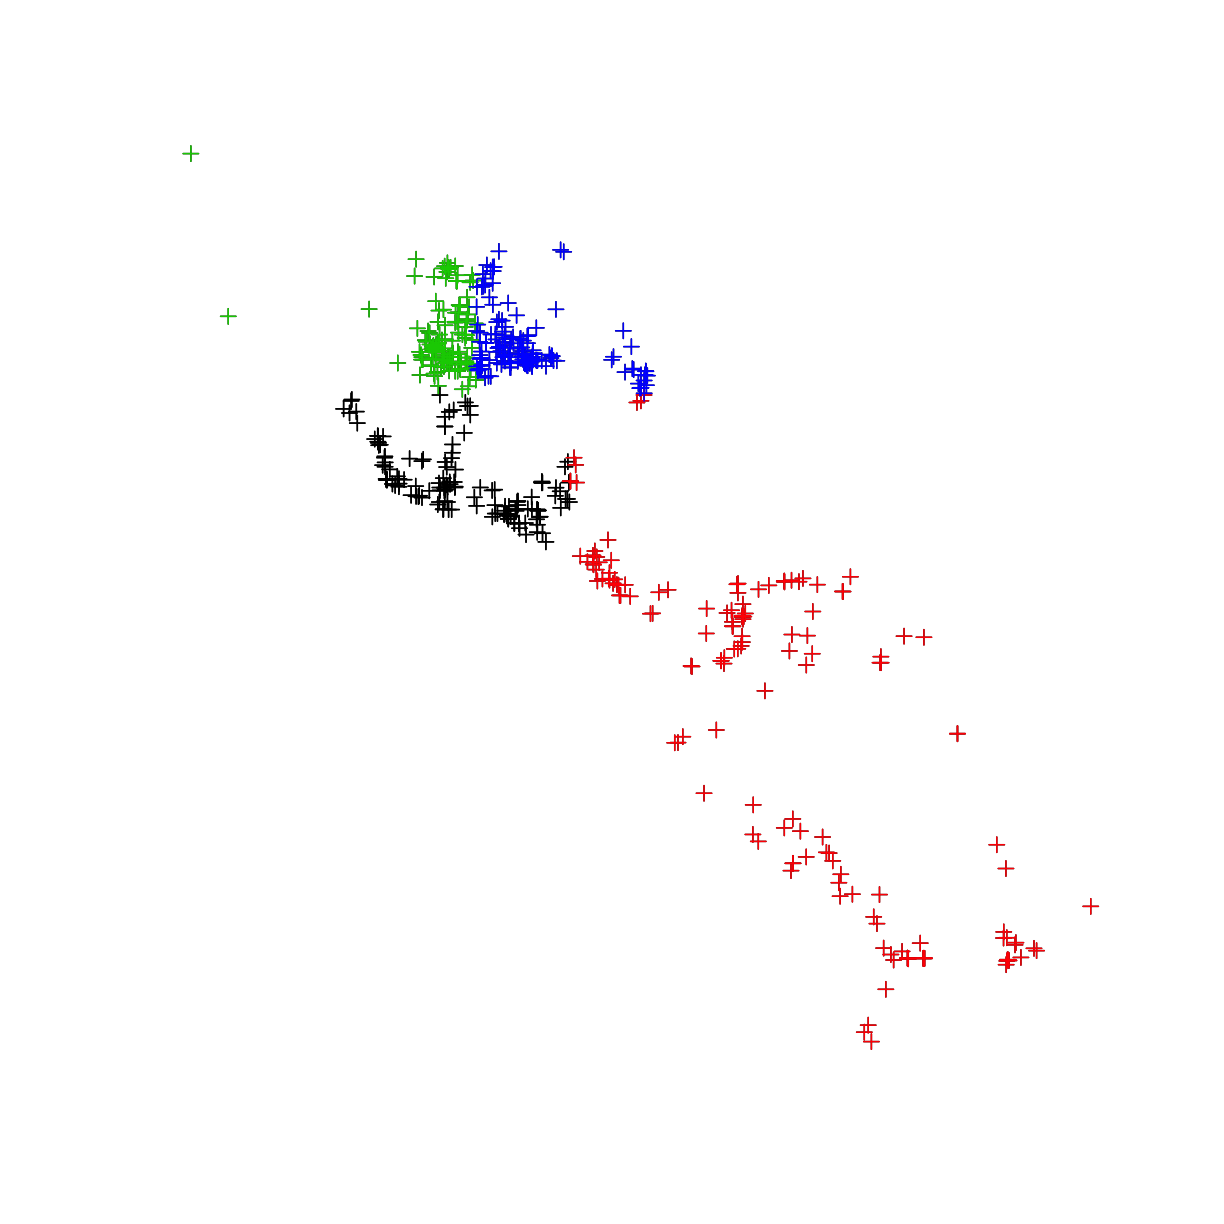
an alternative method, block cut, distributes the training and testing more equally across the study exent. This function is part of the ENMeval package.
library(ENMeval)
cut_block <- ENMeval::get.block(occ=as.data.frame(occ_final@coords),
                       bg.coords=as.data.frame(bg@coords))
occ_final@data$cut_block <- cut_block$occ.grp
bg@data$cut_block <- cut_block$bg.grp

plot(occ_final)
plot(subset(occ_final,cut_block==1),col=1,add=T)
plot(subset(occ_final,cut_block==2),col=2,add=T)
plot(subset(occ_final,cut_block==3),col=3,add=T)
plot(subset(occ_final,cut_block==4),col=4,add=T)
Challenge: use your occurrences to cut raster layers
–load occurrences & raster layers
–build a600,000 meterbuffer around occurrences
–maskraster by the buffer of occurrences
–plot the masked rasterSolution
library(dismo)
library(raster)

dir.create("data")
dir.create("data/bioclim")

if(!file.exists("data/occ_raw.rdata")){
  occ_raw <- gbif(genus="Dasypus",species="novemcinctus",download=TRUE)
  save(occ_raw,file = "data/occ_raw.rdata")
}else{
  load("data/occ_raw.rdata")
}
occ_clean <- subset(occ_raw,(!is.na(lat))&(!is.na(lon)))
occ_unique <- occ_clean[!duplicated( occ_clean[c("lat","lon")]  ),]
occ_unique_specimen <- subset(occ_unique, basisOfRecord=="PRESERVED_SPECIMEN")
occ_final <- subset(occ_unique_specimen, year>=1950 & year <=2000)
coordinates(occ_final) <- ~ lon + lat
myCRS1 <- CRS("+init=epsg:4326") # WGS 84
crs(occ_final) <- myCRS1

if( !file.exists( paste0("data/bioclim/bio_10m_bil.zip")   )){
  utils::download.file(url="http://biogeo.ucdavis.edu/data/climate/worldclim/1_4/grid/cur/bio_10m_bil.zip",
                       destfile="data/bioclim/bio_10m_bil.zip"   )
  utils::unzip("data/bioclim/bio_10m_bil.zip",exdir="data/bioclim")
}

bio1 <- raster("data/bioclim/bio1.bil")

occ_buffer <- buffer(occ_final,width=6*10^5) #unit is meter
bio1_mask <- mask(bio1, occ_buffer)

plot(bio1_mask)
plot(occ_buffer,add=T)
plot(occ_final,add=T,col="blue")